Find further information on the Conservation of Freshwater Ecosystem Values (CFEV) Program and its data at www.dpipwe.tas.gov.au/cfev.
TitleWaterbody naturalness score
CustodianWater and Marine Resources Division, Department of Primary Industries, Parks, Water and Environment
CreatorSteve Carter, Environmental Dynamics
DescriptionAn index which rates the relative ‘naturalness’ or condition of waterbodies based on a selection of input variables.
Input data
Lineage
The waterbody naturalness score (N-score) was developed using expert rules systems. Figure 1 illustrates all the inputs that were either directly or indirectly used to generate the score. Some of the intermediate variables were also calculated using expert rules systems as indicated. Information on expert rules systems can be found in Appendix 3 of the CFEV Project Technical Report.
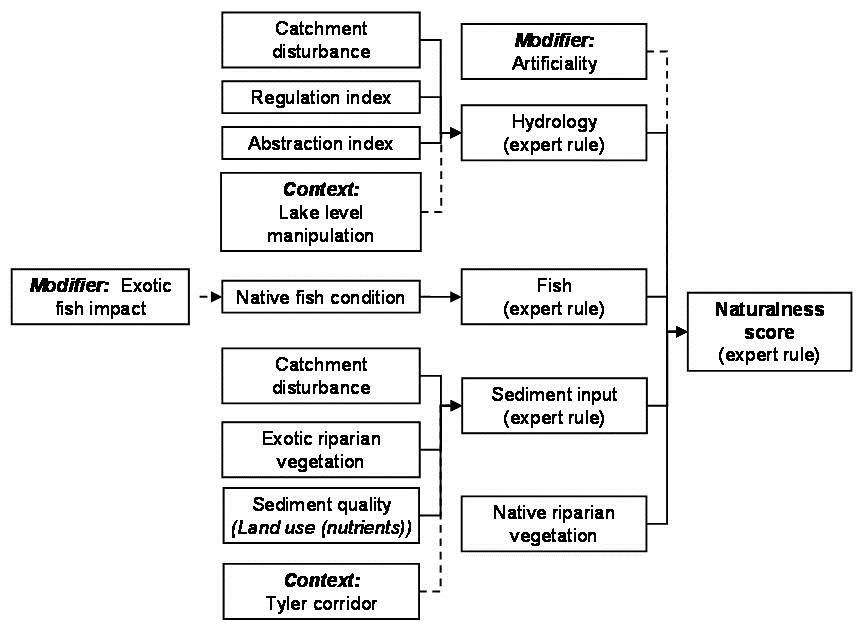
Figure 1. Flow-chart outlining data used in the waterbodies condition assessment to derive a Naturalness score (N-score). Note: variables were combined using expert rule systems where indicated.
The final step in the waterbodies condition assessment is described in more detail here. The N-score was calculated for waterbodies using the outputs from the hydrology, fish and sediment input sub-indices, and native riparian vegetation. Two definition tables were developed for the N-score expert rule system (see ‘Assigning values to ecosystem spatial units’) differentiating between when fish are naturally present and naturally absent. The score was further modified according to whether the waterbody was identified as being artificial or not.
In developing the expert rule systems, the hydrology sub-index was considered by experts to have the major influence on the final score, followed by sediment input, fish and native riparian vegetation.
Naturalness scores for the meromictic lakes of the Gordon River were modified based on knowledge of changes in their meromictic status as a result of flow regulation in the Gordon River (Bowling and Tyler 1986; Hodgson and Tyler 1986, Hydro Tasmania unpublished data). Thus, Lake Morrison, Lake Fidler and Sulphide pool were rated as having an overall condition score (N-score) of 0.2, 0.6 and 0.2 respectively, due to partial or substantial loss of meromictic condition at 2004, which is documented as having occurred between 1975 and 2004.
Date createdFebruary 2005
Scale and coverage1:25 000; Statewide
References
Bowling, L. C. and Tyler, P. A. (1986). Demise of meromixis in riverine lakes of the World Heritage wilderness of south-west Tasmania. Archiv für Hydrobiologie 107: 53-73.
Hodgson, D. A. and Tyler, P. A. (1996). The impact of a hydro-electric dam on the stability of meromictic lakes in the south west Tasmania, Australia. Archiv für Hydrobiologie 137 (3): 301-323.
Column headingWB_NSCORE
Type of dataContinuous but has been converted to categorical format (see Table 3).
Number of classes3
Assigning values to ecosystem spatial units
An N-score (0 = poor condition – 1 = good condition) was assigned to waterbodies spatial units as WB_NSCORE using the expert rule systems shown as a definition tables in Tables 1 and 2. Table 1 shows the definition table for when fish are naturally absent within the waterbody (i.e. WB_FISHC = -9) while Table 2 presents the rules to apply when the fish are present (i.e. WB_FISHC ≠ -9).
Table 1. Expert rules system definition table for the naturalness score for waterbodies that are not artificial (WB_ARTIF = 1), and for when native fish are absent (WB_FISHC = -9).
Hydrology (WB_HYDRO) | Sediment input (WB_SEDIN) | Native riparian vegetation (WB_NRIVE) | Naturalness score (WB_NSCORE) |
H | H | H | 1 |
H | H | L | 0.75 |
H | L | H | 0.6 |
L | H | H | 0.5 |
H | L | L | 0.45 |
L | H | L | 0.3 |
L | L | H | 0.2 |
L | L | L | 0 |
Table 2. Expert rules system definition table for the naturalness score for waterbodies that are not artificial (WB_ARTIF = 1), and for when native fish are present (WB_FISHC ≠ -9).
Hydrology (WB_HYDRO) | Sediment input (WB_SEDIN) | Fish condition (WB_FISHC) | Native riparian vegetation (WB_NRIVE) | Naturalness score (WB_NSCORE) |
H | H | H | H | 1 |
H | H | H | L | 0.9 |
H | H | L | H | 0.8 |
H | L | H | H | 0.7 |
L | H | H | H | 0.65 |
H | L | H | L | 0.5 |
H | L | L | H | 0.45 |
H | L | L | L | 0.25 |
H | H | L | L | 0.6 |
L | H | H | L | 0.4 |
L | H | L | H | 0.35 |
L | H | L | L | 0.2 |
L | L | H | H | 0.3 |
L | L | H | L | 0.15 |
L | L | L | H | 0.1 |
L | L | L | L | 0 |
An additional rule was applied to take into account the artificiality of the waterbody (i.e. WB_ARTIF = 1, if natural or 0 if artificial):
An example of applying the rules is that if the waterbody is natural, fish are naturally present, and it has a HIGH score for hydrology, a HIGH score for sediment input, LOW score for fish condition and a LOW score for native riparian vegetation, then assign a score of 0.6). Using fuzzy logic enables input data and output results to be continuous rather than categorical as implied here (i.e. inputs and output data can range on a continuous scale between 0 and 1, and the process of executing the expert rule system will determine its membership as being HIGH or LOW) (refer to Appendix 3 of the CFEV Project Technical Report for more information on expert rules systems).
The waterbodies spatial data layer has the continuous naturalness data categorised according to Table 3. The categorical data was used for reporting and mapping purposes.
Table 3. Naturalness categories for waterbodies.
Category | Min to max values |
Low | 0 to 0.6 |
Medium | >0.6 to 0.85 |
High | >0.85 to 1 |
CFEV assessment framework hierarchy