Find further information on the Conservation of Freshwater Ecosystem Values (CFEV) Program and its data at www.dpipwe.tas.gov.au/cfev.
TitleWetland naturalness score
CustodianWater and Marine Resources Division, Department of Primary Industries, Parks, Water and Environment
CreatorSteve Carter, Environmental Dynamics
DescriptionAn index which rates the relative ‘naturalness’ or condition of wetlands based on a selection of input variables.
Input data
Lineage
The wetland naturalness score (N-score) was developed using expert rules systems. Figure 1 illustrates all the inputs that were either directly or indirectly used to generate the score. Some of the intermediate variables were also calculated using expert rules systems as indicated. Information on expert rules systems can be found in Appendix 3 of the CFEV Project Technical Report.
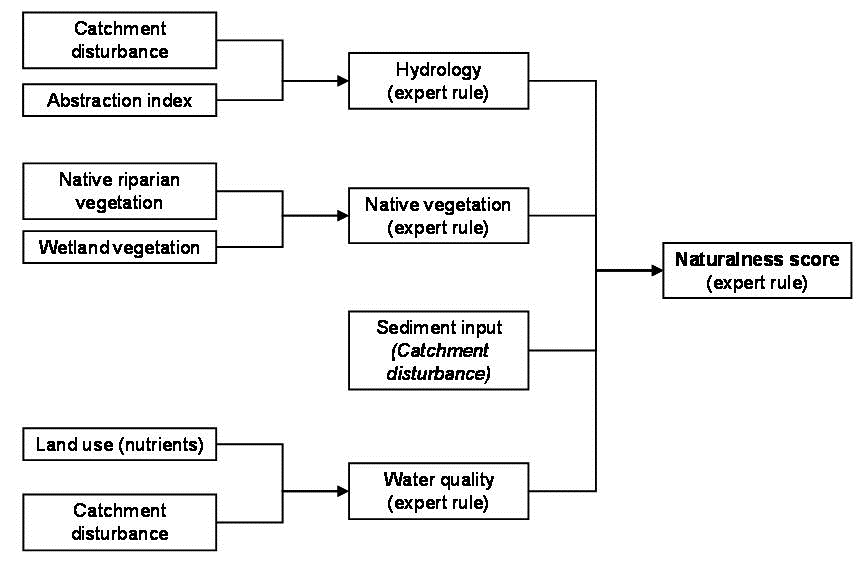
Figure 1. Flow-chart outlining data used in the wetlands condition assessment to derive a Naturalness score (N-score). Note: variables were combined using expert rule systems where indicated.
The final step in the wetlands condition assessment is described in more detail here. An N-score was generated for wetlands using the outputs from the hydrology, native vegetation, sediment input and water quality expert rule systems. The definition table is shown below. The inputs were weighted in order of influence on wetland condition: native vegetation > hydrology > water quality > sediment input.
Date createdNovember 2004
Scale and coverage1:25 000; Statewide
Column headingWL_NSCORE
Type of dataContinuous but has been converted to categorical format (see Table 2).
Number of classes3
Assigning values to ecosystem spatial units
An N-score (0 = poor condition – 1 = good condition) was assigned to wetland spatial units as WL_NSCORE using the expert rule system shown as a definition table in Table 1 (e.g. if the wetland has a HIGH score for native vegetation, a HIGH score for hydrology, a LOW score for sediment input and a LOW score for water quality, then assign a score of 0.7). Using fuzzy logic enables input data and output results to be continuous rather than categorical as implied here (i.e. inputs and output data can range on a continuous scale between 0 and 1, and the process of executing the expert rule system will determine its membership as being HIGH or LOW) (refer to Appendix 3 of the CFEV Project Technical Report for more information on expert rules systems).
Table 1. Expert rules system definition table for the naturalness score for wetlands.
Native vegetation (WL_NATVE) | Hydrology (WL_HYDRO) | Sediment input (WL_SEDIN) | Water quality (WL_WATER) | Naturalness score (WL_NSCORE) |
H | H | H | H | 1 |
H | H | H | L | 0.8 |
H | H | L | H | 0.9 |
H | H | L | L | 0.7 |
H | L | H | H | 0.65 |
H | L | H | L | 0.5 |
H | L | L | H | 0.55 |
H | L | L | L | 0.45 |
L | H | H | H | 0.4 |
L | H | H | L | 0.3 |
L | H | L | H | 0.35 |
L | H | L | L | 0.25 |
L | L | H | H | 0.2 |
L | L | H | L | 0.1 |
L | L | L | H | 0.15 |
L | L | L | L | 0 |
The wetlands spatial data layer has the continuous naturalness data categorised according to Table 2. The categorical data was used for reporting and mapping purposes.
Table 2. Naturalness categories for wetlands.
Category | Min to max values |
Low | 0 to 0.6 |
Medium | >0.6 to 0.85 |
High | >0.85 to 1 |
CFEV assessment framework hierarchy